Tale of two cities: Milan and Rome

I visited both Milan and Rome late last fall. I spent a few days in Milan in mid-November and a few days in Rome in mid-December. I’d been to both cities several times over the years but not since 2012. On my recent trips, I made a point of looking at the ways in which the cities have attempted to join other cities in Western Europe in pushing back a little against the hegemony of the automobile.

First, some background: Milan and Rome are, speaking roughly, cities of approximately the same order of magnitude, but, as is true everywhere, the numbers depend on where one puts the boundaries. The commune (political city) of Rome, with approximately 2.75 million people on January 1, 2024, is roughly twice as populous as the commune of Milan, which had only approximately 1.37 million.1 But the metropolitan areas are much closer in size. The città metropolitana of Rome had 4.22 million people, and the città metropolitana of Milan had 3.21 million in 2023.2 Most non-Italian sources, however, put the Milan region ahead. Demographia, focusing on continuous built-up areas, says that the Milan metropolitan area’s population in 2023 was 5.47 million, while the Rome metropolitan area had only 3.24 million. Eurostat also ranks the Milan metropolitan region first, with 4.93 million, while Rome’s metropolitan region had only 4.29 million (these figures are for 2022).3

Both Milan and Rome are large, complicated urban areas with a huge range of functions. Both have medieval cores (centri storici) of narrow, irregular streets that have been protected assiduously in the years since World War II. The centri storici of both cities are (roughly speaking) surrounded by 19th- and early 20th-century zones of substantial residential and commercial buildings along mostly wider streets. Many of these districts have become pleasantly gentrified, while others have remained less prosperous. Both cities also have diverse and almost always much lower-density suburbs stretching far from their centers.

But Milan and Rome are in some ways quite different from each other. These differences are rooted in their histories. A simple-minded summary would suggest that, while Milan was sometimes a significant place in Roman times, it has chiefly functioned as a center of commerce and industry since the Middle Ages. Rome, in contrast, while often having an important economic role, has also been a political and/or religious center for something like 2500 years.

The two cities’ different foci and histories have had major consequences for their contemporary morphology.

In the second half of the 20th century, Milan found itself with huge areas in its central city that were felt to be devoted to economically obsolete land uses. These were chiefly former industrial areas (but included a too-small fairground). Redevelopment seemed called for, and Milan allowed large corporations to use some of these areas—notably Porta Nuova and CityLife—for corporate skyscrapers, shopping centers, and apartment buildings, often separated by parkland. These new districts are busy, apparently successful places. They are easily accessible both by public transport and by walking from neighboring districts, but there’s also plenty of parking. With their tower-in-a-park designs, both reflect 20th-century ideas about urbanism. They are quite different in character from the surrounding, densely built-up pre-World-War-II neighborhoods.4

CityLife, Milan, Italy

CityLife, a district of starchitect-designed skyscrapers, a big shopping center, and parkland. CityLife, approximately 2.5 km from Milan’s center, replaced what was felt to be an inadequate space for Milan’s trade fairs.

Porta Nuova, Milan, Italy

Road junction, Porta Nuova, Milan. Note the wide roads—automobile access was important to Porta Nuova’s developers. But so was pedestrian, bicycle, and transit access—note the wide crosswalks. The central part of the Porta Nuova development sits on a Corbusier-style platform. The park—the Biblioteca degli Alberi [“Library of Trees”]—is surrounded by office and apartment buildings and a shopping center.

There is nothing comparable in central Rome. Rome has never had a major industrial function, but it does have its own version of obsolete central-city land use. It entered the 20th century with substantial areas of ruins dating from classical Rome. In some earlier periods, these had served as quarries, but, in the era of mass tourism, protection and restoration were clearly the way to go. In so far as Rome has had a need for large new office buildings at all, it’s mostly put them in EUR, approximately nine kilometers south of the Centro Storico, an area that (a little embarrassingly) was planned in the fascist period.

Another difference: Milan, with its role as a center of commerce and finance (and perhaps, if there’s any truth to the stereotype, with a more northern European culture) is richer than Rome. Its GDP per capita in 2021 was 59,901 euros, Rome’s was only 38,697 euros.5  Milan is thus as well-off as most northern European cities; Rome isn’t. This difference has had a major effect on what each city’s government has been able to do.

Both cities have a lot of cars, many more in proportion to their population than in most large northern European cities. Milan had 504 cars per thousand inhabitants in 2021, Rome 626.6 These figures would not seem high in the United States, but they’re higher than in most of Western Europe’s other large cities. Roughly comparable figures for Berlin, London, and Vienna are 331, 350, and 366.7 

Buildings in central Milan and Rome mostly predate World War II, and they generally do not come with parking. There are some underground garages, but most locally-owned cars are parked on the streets. It’s a little startling to see how much space is given over to parking in surface areas of central Milan and Rome. Both cities (but especially Rome) have many (usually 19th-century) wide streets that include median strips that were once the sites of tram lines or parks that have come to be used as parking lots. These days, it’s rare in northern Europe to find parking in analogous spaces.

Parking, Via Giovanni Pacini, Milan, Italy

Parking in the Via Giovanni Pacini’s median strip, near Lambrate station, Milan. Other parts of this street’s median strip are used as a linear park.

Parking, Via Santa Costanza, Rome, Italy

Parking in the middle of the Via Santa Costanza, not far from the Sant’Agnese Metro station, Rome.

In addition, Rome often has parallel parking even on streets of medium width. Of course, this precludes the construction of protected bicycle lanes along these streets.

Parallel parking, Rome, Italy

Parallel parking in Rome.

In the older parts of Rome especially, there is absolutely no “daylighting” of corners. Parked cars block most crosswalks, apparently more or less legally. There are certain parts of Rome’s Centro Storico where, thanks to the narrow streets and much narrower (or non-existent) sidewalks, it’s pretty miserable to be a pedestrian. Driving must be nerve-racking too.

Street, Centro Storico, Rome, Italy

Non-pedestrianized street in Rome’s Centro Storico.

Traffic jams in Milan and Rome are, unsurprisingly, pretty common. Pollution is a problem in both cities, particularly Milan, and especially in winter.

Curiously, drivers in central Milan and Rome are as deferential to pedestrians in crosswalks as any urban drivers in the world. They can be counted on to stop. I was startled to observe that pedestrians often use crosswalks without even glancing to see whether vehicles are coming. (Pedestrians who tried this in, say, Chicago would probably not survive a month.) Despite generally good driver behavior, pedestrian deaths and injuries on urban streets are not rare in either Milan or Rome.

Even if drivers are better behaved than in many places, a general consensus has come into being over the last thirty or so years in both Milan and Rome that public policy needs to focus on reducing urban automobile use. Most of what’s been done will be familiar.

There have been, for example, some limitations on traffic in the central cities. The rules are complicated, and enforcement is said to be spotty, but the general rule is that highly-polluting vehicles are banned from central Milan and Rome during certain hours. In addition, Milan has a congestion charge. There are substantial fines for violators.

Signs describing some of the rules for vehicle access to Area C, Milan, Italy

Signs describing some of the rules for vehicle access to Area C, Milan.

There has also been a great deal of pedestrianization. Efforts in this direction have been much more modest than comparable efforts in, say, Paris, but they’ve nonetheless changed the character of the central cities. In Milan, for example, the piazza in front of the Duomo and many nearby streets have been permanently pedestrianized.

Via dei Mercanti, Milan, Italy

The pedestrianized Via dei Mercanti near Milan’s Duomo.

There are also several cases where only a lane of traffic has been left in place, for example along parts of the Corso Garibaldi, a generally high-end shopping street.

Cordo Garibaldi, Milan, Italy

The Corso Garibaldi, Milan. Note the sign describing the limits on motor-vehicle access.

There has also been a great deal of pedestrianization in the Navigli district, where surviving canals have been turned into tourist attractions. And there are instances of small-scale pedestrianization throughout the older parts of the city.

In Rome, the northern half or so of the Via del Corso, a major shopping street, was pedestrianized many years ago, and numerous nearby streets as well as the Piazza del Popolo at the Corso’s northern end have been similarly forbidden to most motor-vehicle traffic (although exceptions are made for deliveries and taxi drivers going to hotels).

Via del Corso, Rome, Italy

The northern end of Rome’s Via del Corso on a Sunday morning.

Pedestrian paths have also been created in the areas in Rome where ruins from classical Rome have been stabilized and made more or less open for visitors, although some of these paths are a little uncomfortable to follow these days owing to construction work on a Metro Line C extension and preparations for Jubilee visitors.

Metro line C construction near Piazza Venezia, Rome, Italy

Pedestrians making their way between the Coliseum and Piazza Venezia on a route now altered by the construction of a Metro Line C extension.

There are plans to create a seven-kilometer pedestrian path that will take visitors to a number of archaeological sites, but this path does not yet exist.8

As in Milan, there are also instances of pedestrianization scattered widely in the city’s older sections.

Because definitions of pedestrianization are not consistent and the rules for individual pedestrian areas change frequently, it’s difficult to describe pedestrianization with precise maps and figures. The following maps are based in part on data from OpenStreetMap and give an approximate idea of the areas in Milan and Rome that have been pedestrianized.

Map, Milan and inner suburbs, emphasizing rail lines and pedestrian and bicycle facilities

Map of most of the comune of Milan and some of its inner suburbs emphasizing rail lines and pedestrian and bicycle facilities. The nominal scale of the map is 1:40,000. That’s the scale it would have if printed on an 11-x-17-inch sheet of paper. GIS data are mostly from the Geofabrik version of OpenStreetMap. I’ve modified some of the data quite a lot. The map is clickable and downloadable, but note that this site’s host server does not allow images to be stored at their original resolution, and, if you zoom in too far, the image will be blurred.

Map, comune of Rome, emphsizing rail lines and pedestrian and ficycle facilities

Map of the central part of the comune of Rome, emphasizing rail lines and pedestrian and bicycle facilities. The nominal scale of the map is 1:40,000, as on the Milan map. Rome has three rail lines that don’t quite fit the categories used on the map: the interurban Roma-Nord line to Viterbo, which is shown in orange since it runs on city streets in Rome; the Roma-Giardinetti line, also shown in orange since its remaining section also uses streets; and the Roma-Lido line, shown in red since it’s fully grade-separated. See notes with Milan map, just above, for additional information.

Steps have also been taken, especially in Milan, to encourage bicycle use. Both cities have set up bike-share systems and constructed some protected bicycle lanes. Milan has plans to build an enormous spider grid of protected bikeways, although it doesn’t seem as though a huge amount of progress has been made here.9

Protected bucycle lane, Corso Buenos Aires, Milan, Italy

Protected bicycle lane and adjoining supplementary pedestrian lane along the Corso Buenos Aires in Milan.

Rome, with its hills and its insistence that parallel parking is an appropriate use for wide streets, has many fewer cyclists than Milan and has only scattered protected bicycle lanes that most definitely do not make up what anyone would call a network. It has established a bike path (open to pedestrians) along the Tiber, but the Tiber passes through central Rome in a trench several meters below street level, and the path is evidently not considered completely safe. When I was trying to photograph it, I had to wait a long time for a human (a lone runner) to come along.

Bicycle and walking path along the Tiber River, Rome, Italy

Recreational path along the Tiber. The path has both dirt and paved sections.

There have also been major improvements in rail transportation. Milan and Rome both came late to the establishment of Metro systems. Several other large Western European cities had opened their first metro lines by the 1920s. But in Rome the first line (although started in the 1930s) didn’t open until 1955, and Milan had to wait until 1964 for its initial line to begin service. Both cities have continued adding track in succeeding decades. Milan now has five lines. The two newest lines are driverless and take full advantage of driverless technology: trains and stations are short and service is much more frequent than on the older lines.

Interior, Metro line 4, Milan, Italy

Inside a car on driverless Metro line 4, Milan. Note the open gangways.

Rome has been slower to add lines, arguing (not unreasonably) that digging in Rome, which inevitably encounters archaeological artifacts, is extremely expensive since it must be carried out with great care. It now has what could be called two and a half lines (one is still under construction). Milan’s lines are nearly twice as long as Rome’s and (not surprisingly) carry more than twice as many passengers.10

Termini station, Metro line B, Rome, Italy

The Termini station (1955) on Rome’s oldest Metro line, line B.

Both cities also have reorganized their suburban rail lines to make them more useful. Milan has moved much further than Rome in this direction, building a through tunnel (the Passante) for several lines that offers frequent RER/S-Bahn-type service for a regular transit fare in the central city. The lines that don’t go through the Passante mostly end up in Garibaldi station, where transfers between lines and to and from the Metro are possible. Rome’s suburban lines are more traditional. There is only one through line (the FL1). It offers fifteen-minute headways on much of its route. Other lines still end up in the two main rail terminals, Termini or Tiburtina, and provide somewhat less frequent service. 

Both cities still have legacy tram lines. Milan has kept a substantial part of its old tram system intact and even uses a great deal of 1930s rolling stock. Rome runs more modern vehicles, but it’s preserved a much smaller proportion of its old system. Still, there are a couple of lines that cross the 19th-century city, most with branches in the outer city. Most lines in both cities run in dedicated street medians and have middle-of-the-street stations. But the lines are just about all pretty slow. Stops come along frequently, and trains spend a lot of time stopped at red lights.

Trams, Via degli Scipioni, Milan, Italy

Trams in the Via degli Scipioni, Milan.

Tram, Via Emanuele Filberto, Rome, Italy.

Tram in the middle of Via Emanuele Filberto, Rome.

Italy has something of reputation for being a little backward in comparison with other countries in Western Europe, and I wouldn’t say that its attempts to reduce the role of the automobile in Milanese and Roman transportation do anything to contradict its reputation. But, by American standards, both Milan and (to a lesser extent) Rome have still done a great deal to update their rail transportation and to improve life for pedestrians and (in Milan anyway) cyclists in their central cities.

Posted in Urban, Transportation, Rail infrastructure, Pedestrian infrastructure | Tagged , | 1 Comment

Miami’s Underline trail is extended

The recreational path known as the Miami Underline grew by 2.1 miles (3.4 km) on April 24.11

Map, Miami Underline, Metrorail, the Metromover, and other pedestrian facilities, Miami, Florida

Map showing the Miami Underline trail as well as Metrorail, the Metromover, and non-Underline pedestrian facilities in central Miami. The nominal scale of the map is 1:30,000. That’s the scale it would have if printed on an 11-x-17-inch sheet of paper. The base data here come mostly from the Geofabrik version of OpenStreetMap. They have been modified substantially. The map is clickable and downloadable, but note that this site’s host server does not allow images to be stored at their original resolution, and, if you zoom in too far, the image will be blurred.

The Miami Underline, when finished, will run along Miami’s (mostly) elevated railroad, Metrorail, between Brickell, just south of downtown Miami, and South Dadeland, a suburb almost exactly 10 miles (16 km) to the south. There is a real need in Miami for a facility like this—Miami may have fewer recreational trails than any U.S. urban area of its size. The obvious places to build such paths—along the Bayfront and the Miami River—are largely occupied by private developments, and Miami is not the kind of city where governments are going to force property owners to cede land to a recreational trail. There are a few places along the Bayfront and the Miami River where public access is possible, and there are paths in some such places—chiefly near downtown Miami—but they are short. Miami also lacks any major public park (like Central, Lincoln, Golden Gate, or Forest Parks) where recreational trails could be inserted. There is quite a substantial trail in Miami Beach that continues into Miami Beach’s northern neighbors, Surfside and Bal Harbour, but Miami Beach is not Miami.  The Miami Underline’s route was just about the only place where a sizable trail could be built. It’s not, however, ideal.  I walked along the complete alignment in 2022, and, as I reported then, the busy adjacent roadways (especially U.S. 1, the South Dixie Highway), the heavily trafficked cross streets, and the noisy elevated railway overhead are all potential problems. Hardly anyone was using the M-Path, a simple trail along the route that was established when Metrorail was built in the 1980s.

I explored the added segment when I was in Miami last week. It starts impressively with the hard-to-photograph but substantial Hammock Playground, just southwest of Southwest 15th Road. Advocates of the Underline promised a path surrounded by native vegetation, and the playground sits right next to Simpson Park, a remnant tropical forest.

Hammock Playground, Underline, Miami, Florida

The Hammock Playground along the Underline.

The path’s next six-tenths of a mile (1 km) run between the lightly trafficked Southwest First Avenue and Metrorail, which, in this stretch, sits mostly at ground level behind a high wall.

Underline trail, Miami, Florida

The shared northernmost stretch of the newly added Underline segment.

Southwest of there, the path crosses a couple of roads. It solves the crossing problem to a large extent by providing, first, well-marked and vividly painted crosswalks and, second, a button that activates flashing yellow lights. It didn’t look as though most users—and especially not cyclists—were bothering with the button, but these crossings, which are pretty open, did not seem unsafe.

Southwest 26h Road, Underline, Miami, Florida

Crossing Southwest 26th Road.

Southwest of there. the path has separate lanes for cyclists and pedestrians. Pedestrians are supposed to use the right-of-way furthest from the parallel highway, but not all users were respecting the rules.

Underline trail near Vizcaya station, Miami, Florida

Runner on the Underline trail. The photo was taken from the pedestrian bridge over the South Dixie Highway just north of the Vizcaya station. The person running is actually on the bicycle (rather than the pedestrian) lane.

Southwest of Vizcaya Station and just about all the way to Dadeland, the planned route sits right next to South Dixie Highway, a very busy road that’s a continuation of both Interstate 95 and a major arterial, Brickell Avenue. The new segment for the moment only runs approximately two-thirds of a mile (1.1 km) beyond Vizcaya, but that’s enough to get a sense of what the Underline’s builders are planning. Cyclists and pedestrians are separated here, and some new native vegetation has been planted, but it hasn’t had a chance to grow much yet, and the trail feels very open to the South Dixie Highway. There are two street crossings where trail users are expected to obey a traffic light that also allows turns off South Dixie Highway. Southbound drivers who want to make a right turn are warned about users on the Underline, but Metrorail columns prevent their actually seeing the pedestrians until they’re turning. I did not feel very safe at these crossings.

Crossing, Underline trail, Miami, Florida

Sign on the South Dixie Highway that’s supposed to ensure pedestrian/cyclist safety at a crossing.

The Underline now ends just north of Coconut Grove station, approximately 7.3 miles (11.8 km) north of South Dadeland. Construction continues. It’s hoped that the full trail will open by the end of 2025.

I was impressed at how many more users the new segment of the Underline has than I saw on the old M-Path. But I wouldn’t say that it was really busy. When I stopped to take photos, I sometimes had to wait quite a while to get a person in the picture. The Underline’s builders, however, expect that the trail will become busier as it gets longer and becomes better known.

There are a few other elevated railways that pass over underused land in the United States that either now have or could have a recreational trail. For example, there’s been a modestly used trail under the BART tracks in El Cerrito since 1973. The Red and Purple lines now being reconstructed in northern Uptown and southern Edgewater in Chicago could also acquire a recreational trail. Because of the street-crossing problem, none of these trails is ideal, but they do represent a distinct way to take advantage of an awkward land-use problem.

Posted in Urban, Transportation, Pedestrian infrastructure | Tagged | Leave a comment

Visiting a recolonized Hong Kong

Between 1998 and 2019, I visited Hong Kong more than a dozen times. The chief reason was that I was so fond of—as well as fascinated by—the place. Hong Kong satisfies just about all my urban aesthetic preferences. Above all, it’s very dense, with approximately 28,100 people per square kilometer (72,900 per square mile) of buildable land.12 Hong Kong’s population density is, in other words, similar to that of Manhattan’s, but the built-up part of the city covers four and a half times as large an area. Hong Kong is actually in some respects a more high-rise place than Manhattan. According to the Council on Tall Buildings and Urban Habitat, it has more buildings taller than 150 m than any city in the world.13 Furthermore, the proportion of Hong Kong’s population using public transit to get to work—approximately 78%—is probably higher than in any other urban area. Privately-owned automobiles, while rising in number, play only a modest role in ordinary commuting. In addition, while I can’t prove it with numbers, certain parts of the northern end of Hong Kong Island seem to have as high a concentration of activities as any place in the developed world.14

Crowds, Causeway Bay, Hong Kong

Crowds in Causeway Bay, 2024.

Despite the enormous concentration of people and activities, Hong Kong seems to be an extraordinarily efficient place. Train delays are rare. Even traffic generally moves without major backups. Hong Kong is also a pretty safe place. The rate of serious crime is low.

Curiously and somewhat amazingly, Hong Kong, much of which is quite mountainous, may, along with its other distinctions, have more of its territory in parkland than any other city of its size. Approximately three-quarters of its land area is so steep as to be considered unbuildable, and much of this zone is officially parkland. The views from Hong Kong’s hills and mountains never cease to astonish. There are no sharper contrasts between intense urbanism and unbuilt-on land anywhere in the world. I used a view from the slopes of Victoria Peak as a banner for this blog during the first eight years of its existence. Here’s a recent update.

View from Lugard Road, Hong Kong

View from Lugard Road, 2024.

There is no doubt that my positive feelings about Hong Kong have been based largely on its morphology, its physical structure. I’ve enjoyed being in Hong Kong without ever having sustained close personal contact with Hong Kongers. I have had numerous discussions with Hong Kongers over the years that have left me with the impression that citizens of Hong Kong who speak good English (a substantial part of the population) are unusually sophisticated and have traditionally been quite willing to discuss just about any subject openly. It’s significant that in many ways some of them appear to have had closer links with the Western world than with Mainland China, a place that many Hong Kongers have viewed with a certain wary disdain.

I’d last visited Hong Kong in December 2019, when the Umbrella Movement was still active. I stayed away from the protests of course—the presence of foreigners gave the People’s Republic evidence to support its specious claims that the Movement was the result of foreign interference. I did happen to be walking on the pedestrian bridges between the Star Ferry Pier and Central one evening when thousands of people were on their way home from a major demonstration. I’ve probably never been in the middle of a crowd of such, well, calmly happy and satisfied people.

In June 2020, the government took advantage of the Pandemic lockdowns to pass long-threatened security legislation despite enormous demonstrations by Hong Kong’s citizens opposing this step. Since then, the government has jailed numerous people for offenses ranging from wearing a “Free Hong Kong, revolution of our times” t-shirt to publishing newspaper articles urging Hong Kong’s independence. Hong Kongers have suddenly been subjected to the whims of some of the world’s most thin-skinned and ruthless autocrats. Any deviations from absolute conformity on certain subjects have often led to severe punishment.

It’s true that Hong Kong has never been a genuinely democratic place. It was, of course, a British colony between 1841 and 1997. In negotiating the terms of the handover to China, Britain apparently attempted to assure that the government of the Hong Kong Special Administrative Region would be a democratic one, but China resisted, and only some of the members of the Legislative Council (LEGCO), Hong Kong’s legislature, have ever been elected. Still, during the last couple of decades of British rule, the government tried to be responsive to public opinion, and Hong Kong was a pretty free place. You could say or publish what you wanted without having to be worried that you’d be jailed for it. Similar conditions prevailed during the first 23 years after the handover. Hong Kong had a very free press. No subject was off the table. All this ended abruptly in June 2020.

It’s also the case that, for the moment, many aspects of the “one country, two systems” regime are still in place. Hong Kong has its own currency and its own legal system. It still generally uses traditional (rather than simplified) Chinese characters. Traffic moves on the left rather than (as it does in China proper) on the right. The commonest language of public conversation is Cantonese, not Mandarin. You need to pass through Immigration to cross the China/Hong Kong border. And, most important, China has not (yet) imposed the “Great Firewall.” There is still online access to, for example, The New York Times, The Guardian, Gmail, and Google in Hong Kong (all of these, and millions of other, sites are blocked in China). I tried a search on “Tiananmen Massacre” while I was in Hong Kong and ended up with a result very much like that I got with the same search in Chicago. But talking about the Tiananmen Massacre in public can now get you a long jail term. I find this extraordinarily depressing.

I thought for a while I might never visit Hong Kong again, but, lured in part by low air fares, I spent a few days there in late September and early October. I ended up with complicated feelings.

Short of war, the physical form of cities rarely changes abruptly. Hong Kong’s distinctive morphology remains more or less as it was. To someone who likes cities to be dense and a little overwhelming, Hong Kong remains an agreeable place. The most obvious change I noticed was the complete absence of graffiti (which have been banned; writers of graffiti can be jailed). Also, the whole city was plastered with posters and banners advertising the 75th anniversary of the People’s Republic. (Why do authoritarian states think repeating the same message endlessly will convince anyone?)

Signs advertising the 75th anniversary of the PRC, Exposition Centre, Hong Kong

Signs advertising the 75th anniversary of the People’s Republic near the Exposition Centre.

In addition, I had a sense there were fewer foreign (or anyway Caucasian) faces on the streets of Central than there used to be. This is presumably in part the result of the fact that some foreign firms have left, and in part because tourism from the West has dried up (my United flights were two-thirds empty).

There have also been a few changes in areas of particular concern to this blog. For example, there have been two major additions to Hong Kong’s already deeply impressive rail system. The East Rail extension to Admiralty (which includes a new tunnel under the Harbour) has been completed, as has the extension of the (former) West Rail Line through a broad swath of Kowloon that was previously not served by trains at all; this segment has been joined to the Ma On Shan branch and is now known at the Tuen Ma Line.

East Rail train, Hong Kong

Inside an East Rail train under the Harbour.

Here’s a map.

Map, MTR rail lines and pedestrian facilities, Hong Kong, 2024

Map emphasizing rail lines and pedestrian facilities in northern Hong Kong Island and southern Kowloon and vicinity. There are several places in Hong Kong where two or even three MTR rail lines run beside or on top of each other; these are difficult to show clearly on a geographically accurate (as opposed to schematic) map. The nominal scale of the map is 1:40,000. That’s the scale it would have if printed on an 11-x-17-inch sheet of paper. GIS data are mostly from the Geofabrik version of OpenStreetMap. I’ve modified some of the data quite a lot. The map is clickable and downloadable, but note that this site’s host server does not allow images to be stored at their original resolution, and, if you zoom in too far, the image will be blurred.

Also, the Promenade along the Harbour that circles the Exposition Centre has (perhaps temporarily) been extended east for some distance, and the park between the Star Ferry Pier and the Exposition Centre has come closer to being completed.

Promenade between Star Ferry Pier and Exposition Centre, Hong Kong

Newish “promenade” on reclaimed land between the Star Ferry Pier and the Exposition Centre.

Pedestrian walkways have also been extended somewhat east of the Exposition Centre. These allow traffic-free walking between the new subway station there and the adjoining parts of Wan Chai.

Pedestrian walkway, Wan Chai, Hong Kong

Pedestrian walkway between the Exposition Centre, the Wan Chai ferry pier, and Wan Chai proper.

Furthermore, the West Kowloon Cultural District (the subject of an earlier post) has come closer to being completed. Some of the site is still under construction, but the M+ Museum is now open in its permanent quarters (although it’s no longer allowed to hold uncensored exhibitions). Furthermore, there is a great deal more parkland available (but most of it is fenced off and not accessible to people walking about).

Most of these changes in Hong Kong’s physical structure were planned long before the security law was passed, but, despite the Pandemic and Hong Kong’s new politics, they’ve moved forward pretty efficiently. Other long-planned changes remain underway although Hong Kong’s sluggish economy may slow their implementation.

There is no denying that authoritarian regimes do have some advantages when it comes to building infrastructure. It’s pretty clear, however, that many (and very likely most) people in Hong Kong would have preferred not to be living under such a regime. Of course, the people of Hong Kong have had absolutely no choice in this matter.

Posted in Urban, Transportation | Tagged | Leave a comment

Montréal’s REM as North America’s first actual regional railroad (maybe!)

I spent a few days in Montréal last week and naturally went and rode on the now year-old REM (Réseau express métropolitain). I was particularly interested in figuring out just what the REM is. Is it a light-rail line, as some of the REM’s own publicity suggests?  Or perhaps a new metro system? I ended up thinking that what the REM most resembles is a suburban railroad—but with the kind of service you’d expect on a metro. In other words, the REM is the closest thing in North America to a regional railroad, although it’s definitely a new type of regional railroad. This may take a little explanation.

Defining what a regional railroad is isn’t easy, but let me try. In North America at any rate, it’s a rail rapid-transit system with frequent service that runs to a significant extent on long-existing rail lines.15 Often, it also incorporates new rail lines through the city center or to other useful destinations. An important feature of regional railroads is that their fares are integrated with those of other urban transit lines.

Incorporating a regional railroad into an urban area’s transit system has numerous advantages. It adds frequent transit service to new areas. Because stations are further apart than on traditional urban transit systems, a regional railroad is comparatively fast; it can be a kind of express subway. Because fares are integrated with those on other transit lines, passengers can make free or inexpensive transfers to many more destinations. And, because a regional railroad ideally runs through city centers rather than terminating there, railroads can avoid expensive inner-city storage of rolling stock.

Several large European cities—Paris, Munich, Berlin, Hamburg, Oslo, Madrid, and Moscow, for example—have established regional railroads under various names: the RER in Paris, the S-Bahn in German-speaking cities, the T-bane in Oslo, the cercanías in Madrid, and the Central Diameters in Moscow.

In the Western Hemisphere, only São Paulo appears to have a “real” regional railroad. São Paulo‘s Metrô and its long-existing suburban lines have maintained separate corporate identities but have been combined into what is in effect one system. Most suburban trains now operate at rapid-transit frequencies, and one can travel on the whole system with one ticket. In some cases, elaborate transfer bridges and tunnels between the two systems have been built (with electronic tickets, physical connections like these have become less necessary).

Several North American urban areas have transit systems that include suburban rail lines, and there has been talk in several places about using these lines to build regional rail systems as defined above, but no urban area has fully implemented such a system. Toronto may come closest. Toronto’s GO rail and bus lines and TTC subway and bus lines (as well as bus routes run by certain regional operators) achieved fare integration in February 2024, but, for the moment, there is no through-running even on GO’s Lakeshore line, where headways outside of rush hour are every thirty minutes. Most other suburban rail lines in Toronto run much less frequently (and none of the rail lines is electrified).16 Philadelphia’s transit system also comes close to having a “real” regional railroad. Its two groups of electrified suburban railways, which once terminated at two separate stations, were connected by new tracks in 1984, and the combined lines are shown on official schematic transit maps. But service is infrequent on all but the central spine of this system, and there is no fare integration. There is fare integration between the new or newish railroad lines in Denver and Salt Lake City and other RTD and UTA lines, and Denver’s Airport line has fifteen-minute headways during the day, but other rail lines in these urban areas run much less frequently, and the railroad services in Denver terminate at Union Station rather than running through the central city. Other North American transit systems are just about all further from the ideal. Suburban railroads almost never run at rapid-transit frequencies (except in a couple of places where several lines come together near their termini), and there is no fare integration with other transit systems or through-running on these lines. Transit operators in several cities—Boston, for example—have discussed instituting regional rail service, but, thus far, only Montréal has actually begun to operate such a system, although, even there, through-running won’t start until next year.17

The 17-km REM segment that opened last year is in some ways atypical, since hardly any of it relies on long-established railroad rights-of-way. It runs between Central Station and suburbs on the south bank of the Saint Lawrence River. Its Central Station alignment has been there since Central Station opened in 1943, but the line works its way down to the Saint Lawrence on a newly-built elevated guideway.

REM train, Griffintown, Montréal, Québec

REM train passing through Griffintown, just south of Montréal’s Central Station. A station here is planned.

Most of the line runs down the middle of the A10 autoroute. Only one station—Du Quartier—is located in a heavily built-up district. I’m pretty sure that most passengers arrive at other stations by car or bus.

REM train, Autoroute 10, Du Quartier station, Brossard, suburban Montréal, Québec

REM train arriving at Du Quartier station. Photo taken from a pedestrian bridge over Autoroute 10.

The southern terminus, Brossard, sits next to an enormous parking lot—and not much else.

Parking lot, REM terminus, Brossard, suburban Montréal, Québec

The Brossard parking lot early in the morning. The REM’s southern terminal station is in the background.

The initial line has been carrying around 24,000 passengers a day.18 It’s crowded with commuters during rush hour.

REM train, interior, southern suburbs, Montréal, Québec

Inside a REM train heading to central Montréal during the morning rush hour.

But it tends to run pretty empty at other times.

REM train, Montréal, Québec

Inside a reverse-commute REM train at Central Station early in the morning.

New stations—even those above ground—all have platform doors and HVAC systems. The fact that the stations are more or less indoors makes even those that sit in the middle of a freeway reasonably comfortable places to wait (although there isn’t much seating).

Du Quartier REM station, suburban Montréal, Québec

Inside the Du Quartier REM station.

The lines that are supposed to open next year will all pass through Montréal’s CBD and the 106-year-old Mount Royal Tunnel and serve several somewhat walkable neighborhoods in the outer city. They will intersect with the Métro in a couple of places and, of course, with numerous bus routes. The western branch planned to have the most service—the northern line to Deux-Montagnes—runs along a right-of-way that was used as a suburban commuter line for several decades. Most places along the route could be classed as “medium-density suburban.” The other two western branches take advantage of old rail rights-of-way only for a short distance. The middle branch will largely run elevated through car country next to a freeway. The southern branch (not scheduled to open until 2027) will end up at Trudeau International Airport. It’s hoped that passenger loads on the new lines will be substantial. We’ll see.

Map, REM and Métro rail transit lines and pedestrian and bicycling facilities, Montréal and vicinity, Québec

Map of Montréal and vicinity emphasizing REM and Métro rail lines and pedestrian and bicycle facilities. Commuter rail lines, most of which have only prevailing-direction weekday rush-hour service, are not included. The nominal scale of the map is 1:100,000. That’s the scale it would have if printed on an 11-x-17-inch sheet of paper. GIS data are mostly derived from the Geofabrik version of OpenStreetMap. I’ve edited all the data. REM U/C = REM line under construction. I was unable to find an up-to-date file for the latter. As a result, there may be some small errors in the location of the pending REM routes. As usual, pedestrian and bicycle facilities are sometimes not as clearly distinguished on the ground as they seem to be on the map. The map is clickable and downloadable, but note that this site’s host server does not allow images to be stored at their original resolution, and, if you zoom in too far, the image will be blurred.

The REM’s great innovation—which differentiates it from most other regional railroads—is that it’s driverless.

View from front window o REM train, suburban Montréal, Québec

Since there is no engineer’s cab, the REM has front windows that provide excellent views of the right-of-way.

Like some other driverless transit systems, the REM runs short trains (of two or four cars) at frequent intervals, around every two-and-a-half minutes during rush hour. It can do this easily since additional labor costs from frequent service on a driverless metro are minimal. Money was also saved by the need only for short stations.

There is complete fare integration with other transit systems in Montréal. A single ticket allows one to ride on all of Montréal’s transit lines within the fare zone and time limits stated on the ticket.

In other words, thanks to its frequent suburban service, the REM comes closer than any other North American transit system to being a regional railroad as defined above.

Notably, however, the REM’s builders and operators do not call it a regional railroad. It’s a “light metro” (or “métro leger” in French). Perhaps “light” has a positive connotation in both languages, while “regional railroad” is too technical a term to be widely understood (it wouldn’t be understood by many urban transit specialists in Europe or Asia either).

In the years since Québec’s “Quiet Revolution,” Montréal has been a North American pioneer in several areas of urban development. It was, for example, the first North American city in which aesthetic appeal played a central role in the design of subway stations (1966) and the first city with an extensive network of underground passageways in its CBD (also 1960s). It was also an innovator in downtown pedestrianization (1980s-), and it was the first North American city to construct numerous protected bicycle lanes (early 2010s). The REM, which really is different from any other North American rail system, seems to continue the pioneering tradition.19

I am sure that there are lots of people in the world of transit who have pondered using the REM as a model for other cities. Its ability to run trains frequently without incurring enormous labor costs is a potential game changer. Several suburban rail lines in Boston and Chicago (among other cities) would seem to be good candidates for much more frequent service if labor costs could be kept down—and transfers to other transit services became cheap or free. But there would be substantial starting costs: even short stations turn out to be expensive to build, and electrification and new rolling stock would be needed in most cases. And any new system would require considerable debugging. The REM certainly did.20 It’s easy to imagine that the REM’s role in the development of North American urban transit will (like that of Montréal’s elegant Métro before it) turn out to involve a challenge to other cities that they will find very hard to meet.

Posted in Urban, Transportation, Rail infrastructure | Tagged | Leave a comment

Strasbourg builds “pedestrian arterials”

Governments of most cities in Western Europe have been trying over the last thirty (or more) years to reduce the role of the automobile in urban transportation. They’ve built new rail lines and renovated old ones. They’ve created elaborate bicycle infrastructure. And they’ve tried to improve conditions for pedestrians.

Comparison of efforts in different cities is difficult; there is no unambiguously best way to do this. But it is arguable that, when it comes to producing prose about the new policies, the French have been as prolific as anyone. This is particularly true when it comes to describing work to improve conditions for pedestrians. Lyon21 and Bordeaux22, for example, have issued elaborate plans for pedestrianization. Strasbourg, at least in proportion to its population,23 has arguably done more planning than any other urban area. Its government has produced at least two substantial plans for new pedestrian infrastructure, in 201124 and in 2021.25 These plans have been widely disseminated. Some staff members have been making a career of going around the world to describe the plans.26 It’s significant that the pedestrian plans appear to have attracted a considerable amount of local support.27 Strasbourg’s tourist office has argued that the city’s walkability is one of the chief reasons for paying a visit.28

Much of what’s in Strasbourg’s plans would not surprise anyone. Walking, the plans argue, accounts for a substantial proportion of daily trips, but, during the several decades (the era of “tout automobile”) when improving conditions for drivers seemed like the most important goal of urban planners, pedestrian spaces were consistently reduced in size. Pedestrians not only need more space, the plans contend, but they also need to be made more secure. Pedestrian traffic should be kept as separate as possible from automobile—and bicycle—traffic. Possibly the most distinctive component of Strasbourg’s plans has been a proposal to build what are called “magistrales piétonnes,” a term that can be approximately translated as “pedestrian arterials.” These are substantial corridors devoted more or less exclusively to pedestrian use. The latest (2021) pedestrian plan shows one such arterial—between the train station and the Parc de l’Étoile in Neudorf (a distance of approximately 1500 m) —mostly completed and a couple of others—to the Rhine and along the Ill River—well underway. It also proposes a network of such magistrales piétonnes covering the entire urban area.

I went to take a look at Strasbourg’s pedestrian arterials (and other new non-automotive infrastructure) late last month. As it happens, I didn’t know Strasbourg very well. I’d been there only twice before, in 1969 and again in 2008, both times for a day or two. I’d been impressed the first time by all the half-timbered buildings that had somehow survived into modern times (although I was skeptical as always about the extent to which many of these might have been [re]created mostly to please tourists), and I’d been impressed on the second trip by the then still newish tram system, one of France’s largest. The first line opened in 1994, and the system’s been systematically enlarged in the decades since then. In 2017 it reached Kehl, a suburb across the Rhine in Germany. This branch is one of the world’s very few international tram lines.

Map, rail transit lines and pedestrian and bicycle facilities, Strasbourg, France (and Germany)

Map of Strasbourg and vicinity emphasizing rail transit lines and pedestrian and bicycle facilities. The nominal scale of the map is 1:50,000. That’s the scale it would have if printed on a 14-x-14-inch sheet of paper. GIS data are mostly derived from the Geofabrik version of OpenStreetMap. I’ve edited all the data. Note that “pedestrian facilities” include some streets that are open to vehicles part-time. It also includes substantial sidewalks in a few places. It does not include streets classified as “living streets” in the OpenStreetMap database, that is, streets open to automobiles but with pedestrian priority. The map is clickable and downloadable, but note that this site’s host server does not allow images to be stored at their original resolution, and, if you zoom in too far, the image will be blurred. 

Map, rail transit lines and pedestrian and bicycle facilities in central Strasbourg, France

Map of central Strasbourg emphasizing rail transit lines and pedestrian and bicycle facilities. The nominal scale of the map is 1:20,000. That’s the scale it would have if printed on a 14-x-14-inch sheet of paper. See notes with preceding map for additional information.

The one nearly completed magistrale piétonne starts with a large pedestrian space in front of the main train station.

Gare, Place de la Gare, Strasbourg, France

The Place de la Gare.

It continues to the heart of the central city, running along the Rue des Grandes Arcades, perhaps Strasbourg’s most important commercial street.

Rue des Grandes Arcades, Strasbourg, France

The pedestrianized Rue des Grandes Arcades.

South of the central city the designation of a street as being part of the magistrale piétonne has mostly meant that it’s acquired wider sidewalks and a protected bicycle lane. Here, for example, is a photo of a part of the Route du Polygone, a kilometer or so south of the Rue des Grandes Arcades.

Route du Polygone, Strasbourg, France

Along the Route du Polygone, south of central Strasbourg.

Here’s another example: the Quai des Bateliers, which runs along the Ill River, Strasbourg’s inner-city river, along which a second medium-distance magistrale piétonne is being built (there are still gaps).

Quai des Bateliers, Strasbourg, France

The pedestrianized Quai des Bateliers, which runs along the Ill River.

In addition to the newish pedestrian areas along (or essentially replacing) surface streets, Strasbourg also has pedestrian paths along its watercourses, notably the Ill River and associated streams. Many of these are located where there were once towpaths. These paths, however, are often not quite continuous.

Path along Ill River, Strasbourg, France

Near water-level path along the Ill River.

There are also pedestrian paths along the Canal du Rhône au Rhin and other man-made watercourses that run through what was once a major industrial area south of the central city. This area’s renewal is a component of the Deux Rives/Zwei Üfer project, which proposes using the land on both sides of the Rhine for housing, commerce, and parks. The area’s walkability has been touted as one of its virtues.

Bassin d'Austerlitz, Canal du Rhône au Rhin, Strasbourg, France

Paths along the Bassin d’Austerlitz, part of the Canal du Rhône au Rhin, now lined with new housing and the Rivetoile shopping center.

One of the suggestions in the pedestrian plans is that officials should be aware of pedestrian preferences in everything they do. Perhaps this is the reason that the two substantial bridges on the newish tram line to Kehl incorporate wide paths for pedestrians and cyclists. There are now two pedestrian/cyclist bridges over the Rhine—plus a sidewalk on the main road bridge! Perhaps because this part of the urban area is still somewhat industrial, there aren’t a huge number of pedestrians or cyclists on the bridges, but there are a few.

Pedestrian/cyclist/tram bridge over the Bassin Vauban, Strasbourg, France

The pedestrian/cyclist/tram bridge over the Bassin Vauban. Both the path and the tram line end up in Kehl, Germany.

I wouldn’t say that Strasbourg’s central-city pedestrian streets are perfect. Cyclists and scooter drivers sometimes—illegally—ride on some of them, and van drivers—legally—make deliveries on some pedestrian streets early in the morning. There is also (as elsewhere) the awkward problem of “pedestrian-priority” streets, where drivers are supposed to give way to pedestrians. This usually doesn’t work smoothly—pedestrians typically cede the right-of-way first.

There is also, as everywhere, an awkward problem where pedestrian paths are interrupted by major roads for cars. Such intersections usually have traffic lights, and drivers tend to obey them, but sometimes pedestrians face a long wait. Here’s a photo of the crossing of the original magistrale piétonne and the Quai du Général Koenig, just south of the central city (note the large number of pedestrians and cyclists).

Street crossing, Quai du Général Koenig, Strasbourg, France

Crossing the Quai du Général Koenig.

Despite these caveats, Strasbourg certainly seemed to me a congenial place for pedestrians. There are lots of people walking on the streets not only in the central city but in many of its residential districts as well. There are also a very large number of cyclists.29 Perhaps because facilities for pedestrians and cyclists are so good, there are actually relatively few cars in central Strasbourg. On the whole, it appears to be quite a secure place for pedestrians. Even in the outer city, drivers usually defer pretty much automatically to pedestrians in crosswalks and when making turns.

I wouldn’t say, however, that, despite all the planning, pedestrians seemed dramatically if at all better off in Strasbourg than in other big French cities. After all, it’s become pretty standard to pedestrianize streets in central cities in France. The more or less completed magistrale piétonne isn’t visibly marked as such, and it doesn’t feel a whole lot different from other pedestrianized streets in Strasbourg—and elsewhere in France. The planning of magistrales piétonnes may have encouraged the authorities to make Strasbourg’s pedestrian corridors more continuous than in some other cities, but it doesn’t appear to have resulted in corridors that are physically distinctive. They’re still quite impressive, however. No North American city has attempted anything like the amount of pedestrianization that is widespread in Strasbourg and many other French (and Western-European) cities.

Posted in Urban, Transportation, Rail infrastructure, Pedestrian infrastructure | Tagged | Leave a comment

New or newish rail transit lines and pedestrian facilities in Istanbul

Haliç Metro [and pedestrian] Bridge. Golden Horn, Istanbul, Turkey

View north from the Haliç Metro Bridge (2014), a bridge that takes subway trains and pedestrians across the Golden Horn. The park on the right is one of several newish parks on the shores of the Golden Horn.

I’ve been in Istanbul twice in the last few weeks, first in early May, then in mid-June. Except for a couple of stops at the enormous new airport, I had last been in Istanbul in 2014. Between 1969 and 2014, I’d visited Istanbul quite a few times and had come to know the city moderately well.30

Since my first trip, Istanbul has changed enormously. In 1969, the urban area had a population of something like two million.31 Today, more than fourteen million—and perhaps as many as sixteen million—people live in the Istanbul metropolitan area.32 If Istanbul is counted as a European city, it’s the second largest (Moscow is first). It’s considerably larger than London or Paris.

Most of the population growth of Istanbul over the last half century has taken place in newly created neighborhoods outside the old city. Istanbul now sprawls over something 1500 square kilometers. Newer parts of the Istanbul area are extremely diverse. There are informal settlements (gecekondular), and there are also numerous neighborhoods of high-rise apartment buildings for middle-class and wealthy residents.

Residential neighborhoods, Asian side, Istanbul, Turkey

View of diverse neighborhoods climbing the hills on Istanbul’s Asian side. The photograph was made from the recreational path along the Sea of Marmara.

Density is generally pretty high (the average is approximately 10,000 people per square kilometer), but many of the newer parts of the urban area were built in part to accommodate automobiles. Since (roughly) the 1970s, there has been a major effort to construct highways to facilitate traffic movement throughout the region. An elaborate freeway network now covers much of the Istanbul area. It includes three bridges and a tunnel across the Bosporus (1973-2016). A new tunnel is planned.

Just as is true almost everywhere, road building has not been able to keep up with demand. Istanbul has had a congestion problem for many decades. Traffic jams on freeways and urban streets are extraordinarily common. Traffic accidents occur frequently. Air quality, despite the proximity to large water bodies, is sometimes poor.

Road-based public transportation has been one of the casualties of automobilization. As late as the 1980s, public transportation in Istanbul chiefly involved buses and vans (dolmuşlar) on public roadways that simply could not operate efficiently because of traffic tie-ups. This is a problem, since millions of people in Istanbul have no access to a car and depend on public transportation to get around.33

Traffic, Kennedy Cadessi,  Yenikapı, Istanbul, Turkey

Traffic at a standstill on the highway that leads to and from the Avrasya (Eurasia) Tunnel. Photograph taken in Yenikapı.

Istanbul’s planners and other government officials have been well-informed about developments in Western European urbanism for decades, and they were certainly aware in the 1980s that many Western European cities had begun to try to mitigate automobile congestion by building new rail transit lines on a large scale—and also by creating more spaces for pedestrians. Turkey was generally doing well economically in these years, and it was clear to many people in a position to make decisions that it was time to follow Western Europe’s lead.34 The victory of the Motherland Party in 1983 national elections and in 1984 local elections set the stage for formulation of new urban policies. Prime Minister Turgut Özal and Istanbul mayor Bedrettin Dalan worked together for nearly a decade to implement these, and, while there was a hiatus in roughly the 1990s, governments in the years since have continued along much the same lines.35 As in many of the world’s other major urban areas, while governments in Istanbul over the last few decades have continued to work on improving the road network, there has been a shift toward supporting alternatives to movement by automobile. On the one hand, an elaborate rail network has been built; and, on the other hand, steps have been taken to make it easier to get about on foot, particularly in the central city.

I tried on my recent trips to take a close look at more or less recent developments in both of these areas.

Rail transit. When I was first in Istanbul, there were only modest rail facilities: somewhat decrepit suburban railroads along the European and Asian shorelines of the Sea of Marmara and the Tünel, a short underground funicular railway connecting Karaköy with Beyoğlu, 560 m away and 60 m higher. The Tünel (1875) is claimed to be the world’s second underground urban railroad, after London’s.36 Istanbul had had a tram system, but it was closed in the 1960s.

The first new lines were rather short. In 1989, the M1, a “light metro” line between Aksaray, a major commercial center on the Historic Peninsula, and Esenler, a rapidly growing residential district roughly seven kilometers northwest of Aksaray, opened. Over the next few years, it was extended west to a long-distance bus station and then (via a separate branch) to what was then the city’s major airport, Atatürk Airport. In 1992, it was joined by the T1, a 6-km-long tram line between the old train station, Sirkeci, and Topkapı, near the Theodosian Walls that more or less mark the edge of the old city. The line has since been extended in both directions. The T1 could be classified as a light-rail line. It mostly runs down the center of relatively wide roads. Tracks were eventually protected by a formidable fence. In crowded Sultanahmet, the tram line occupies an entire, narrow street. It operates in traffic only in a few places, but there are numerous level crossings with traffic lights. Thus, it isn’t very fast, but it’s definitely faster than a bus could be.

T1 tram, Galata Bridge, Istanbul, Turkey

A T1 tram crossing Galata Bridge. The tram line has its own right-of-way in the center of the roadway.

The first metro and tram lines attracted a substantial number of passengers. A consensus developed that more lines were needed, and, in the last 35 years, Istanbul has opened an astonishing 243 km of fully grade-separated, mostly underground, modern metro lines and 45 km of partly grade-separated light-rail lines (these figures include the initial sections). The lines are generally state-of-the-art. Electronic signs in stations and in cars provide travel information. Metro trains have open gangways. Handicapped access is common. And the newest metro lines are driverless and have platform doors.

Alibeyköy station, M7 line, Istanbul, Turkey

The Alibeyköy station on the M7 line. Note the platform doors. This is one of the few above-ground stations on Istanbul’s newer Metro lines.

In addition, the long-existing electrified suburban railroads running along the Sea of Marmara have been thoroughly renovated and joined via a 13.5-km-long rail tunnel under the Bosporus. The result is a 77-km-long regional passenger rail line with frequent service that is pretty well integrated with the Metro and light-rail lines. Istanbul also has four funicular railroads (including the Tünel) and two overhead-cable lines (teleferikler) that connect additional points. Among European cities, only Moscow has added comparable amounts of track over the last thirty-five years. And Istanbul isn’t finished. More than 100 km of additional rail lines are now either under construction or very close to being begun. And there are plans to add more track in coming decades, including an express metro across the Bosporus. Here are maps:

Map emphasizing rail lines and pedestrian and bicycle facilities, Istanbul and vicinity, Turkey.

Map of Istanbul and vicinity emphasizing rail transit lines and pedestrian and bicycle facilities. The nominal scale of the map is 1:175,000. That’s the scale it would have if printed on an 11-x-17-inch sheet of paper. GIS data are mostly derived from the Geofabrik version of OpenStreetMap. I’ve edited all the data. Note that “pedestrian facilities” include some streets that are open to vehicles part-time. It also includes substantial sidewalks in a few places. The map is clickable and downloadable, but note that this site’s host server does not allow images to be stored at their original resolution.

Map, central Istanbul emphasizing rail lines and pedestrian and bicycling facilities, Turkey

Map of central Istanbul emphasizing rail transit lines and pedestrian and bicycle facilities. The nominal scale of the map is 1:50,000. That’s the scale it would have if printed on an 11-x-17-inch sheet of paper. See notes with preceding map for additional information.

Istanbul’s urban rail system has several peculiarities.

The system’s planners have aimed to cover the entire metropolitan area with a kind of grid rather than to orient the lines to a central business district. This makes sense, because Istanbul, in addition to its historic centers, has several outlying commercial districts, and desire lines (as is normal in a large urban area whose morphology has been influenced by the automobile) move in all directions. One problem with this approach, however, is that the lines that do pass through the traditional centers (the M2 and T1) can be tremendously overcrowded at the height of rush hour despite running with very short (sometimes less-than-two-minute) headways, while some of the outer-city lines, despite longer headways, have relatively few passengers. The M11, a 46-km-long, 120 km/h line to the new airport, for example, gets by with four-car trains that run every twenty minutes through stations designed for longer trains.

M2 Metro train, Istanbul, Turkey

Inside an M2 train on a not-so-crowded holiday afternoon.

Another peculiarity is that there are no free transfers. You have to pay every time you enter a station, even when you’re just taking one of the funiculars. Riders who register their transit cards (that is, most riders except tourists) do get a discount for additional rides within two hours. And fares by European standards are pretty low, approximately 0.55 USD at the rate of exchange that was available when I was in Istanbul. But trips that require several transfers can seem expensive.

Also odd: Except on the Marmaray line (where you have to pay extra to cross between Europe and Asia), the cost of rides is not distance-based. You pay the same no matter how far you’re going as long as you stay on the same line

Also distinctive: You sometimes have to walk quite a way when transferring. It’s nearly 500 m, for example, between the Haliç station on the M2 line and the Küçükpazar station on the T5 line and approximately 300 m (plus six long escalator rides) between the lines that stop at the two Gayrettepe stations. The two Kağıthane stations are just as far apart.

Still, Istanbul’s rail lines are generally considered an enormous success. It’s hard to find meaningful up-to-date statistics, since some lines have only just opened and Covid has affected ridership, but it appears that the Metro, the tram lines, and Marmaray have been attracting something like two million passengers a day in all. Bus usage is close to three million rides a day, more than that of the rail lines, although presumably rides are on average shorter than on trains.37 It’s really hard to imagine Istanbul without all the new or newish rail transit.

Pedestrian facilities. Istanbul’s governments have also put a great deal of energy since (roughly) the 1990s into improving pedestrian facilities in Istanbul, partly by reducing the areas that automobiles can access and partly by reconstructing substantial parts of the city.

To understand the recent emphasis on pedestrian facilities in Istanbul, it’s important to say that Turks seem as likely to walk places as people in Western Europe.38 Except along the freeways and boulevards that have been added since the 1980s, central Istanbul is full of people on foot. Many pedestrians, it’s true, are tourists (especially in Sultanahmet), but there are plenty of Turks as well.

Pedestrians, Eminönü, Istanbul, Turkey

Crowds moving through Eminönü. Eminönü is a major transit hub. There are two tram stops, and a Metro station and a bus terminal are nearby. In addition, numerous ferry lines terminate here. Eminönü is also adjacent to several tourist attractions.

A factor may be that central Istanbul is one of the world’s great urban places for walking, and not only because its built environment contains such a complicated mixture of buildings from many different eras. The key fact is that, because it was already a large city before the automobile came along, it’s very dense. The population of the city in 1914 was 1.1 million; it was the 19th largest city in the world.39 Virtually the entire population lived either in the Historic Peninsula, east of the Theodosian Walls (that is, in what is now the municipality of Fatih), or else in Beyoğlu (across the Golden Horn from the Historic Peninsula) or in Üsküdar (on the Asian side). Nearly the entire area was built up to a high density, and walking was the main transportation mode for a large part of the population. This area has changed enormously since then. Several roads have been pushed through the old city, and spaces around some of the older buildings (like Aya Sofia) have been opened up. But at least a large part of the urban fabric of the old city still dates to some extent from the period before World War I. Streets can be extraordinarily narrow. Buildings typically touch neighboring buildings. Residential, commercial, and religious land uses are jumbled together. Poor people and (thanks to gentrification) an increasing number of well-off people live in close proximity.40 Istanbul’s central neighborhoods work for pedestrians in part because they still to a large extent have the fine-grained texture of the older city. The pleasures of walking in central Istanbul are not exactly a secret. Turkey’s best-known novelist, Orhan Pamuk, has written eloquently about this subject.41

Walking in central Istanbul, it must be added, has its issues. Sidewalks, if they exist at all, are sometimes in poor shape. There are frequent steep slopes. And car drivers cannot be counted on to defer to pedestrians at crosswalks or when making turns. That’s one of the reasons that reducing car usage has been an important component of pedestrianization.

Pedestrian life in Istanbul has been facilitated by government actions that (like the building of new rail transit lines) began in the 1980s with the newly elected officials of the Motherland Party. One of Mayor Dalan’s major goals was to clean up the Golden Horn region, which (thanks to earlier government efforts) had become a center of often highly polluting industry. In the 1980s, the waters of the Golden Horn were horribly polluted, not just by industry but also by uncontrolled sewage runoff. Mayor Dalan somehow managed to bulldoze hundreds of factories—and to replace them with dozens of parks, which are now some of Istanbul’s most important spaces for pedestrians. 42 His administration also managed to modernize Istanbul’s sewage system, thus making proximity to the waters of the Golden Horn a pleasure rather than something to be avoided.

Path on the Golden Horn, T5 tram, Istanbul, Turkey

Path and park on the south bank of the Golden Horn. A T5 tram is visible on the left.

Mayor Dalan was, however, guilty of doing some damage to pedestrian life when his administration added several new major roads through the central city. Some of these (for example, Karaağaç Caddesi) blight the waterfronts he helped clean up.43 Perhaps most damaging of all was Tarlabaşı Boulevard, which was rammed through Beyoğlu between the Atatürk Bridge and Taksim Square. A substantial swath of high-density residential land in Beyoğlu was destroyed in the process of building this boulevard. But another consequence of the building of Tarlabaşı Boulevard was that it allowed İstiklal Caddesi, a major commercial and residential street in Beyoğlu, to be converted into a pedestrian corridor. The pedestrianization of İstiklal Caddesi in turn encouraged middle-class resettlement in a dense urban neighborhood that had become more than a little out-of-fashion. The street today is perhaps Istanbul’s most important pedestrian thoroughfare. It’s crowded between mid-morning and late evening. The “nostalgic tram” line that runs, mostly on a single track. down the middle of the street adds to its charm. Many side streets in Beyoğlu have also been pedestrianized. And, at the northern end of İstiklal Caddesi, Gezi Park is now just about the largest open space in Istanbul’s modern center, thanks to the placement of most traffic in tunnels below the park.

İstiklal Caddesi, Istanbul, Turkey

İstiklal Caddesi.

Across the Golden Horn, the Historic Peninsula has been subjected to an even more aggressive pedestrianization process. The Istanbul Metropolitan Municipality, with the help of the municipality of Fatih as well as Gehl Architects and the Turkish branch of Embarq, has managed to pedestrianize at least 295 streets. It’s true that many of these streets are so narrow that automobile access was practically impossible, and it’s also true that, on some streets, deliveries are allowed during certain hours and that enforcement of the laws seems spotty.

Pedestrianized street, Eminönü, Historic Peninsula, Istanbul, Turkey

Pedestrianized street in the Historic Peninsula,

Nonetheless, in a large part of the eastern end of the Historic Peninsula, it appears to be the case that most people once again get about chiefly on foot. Tram travel seems to be the second most important travel mode. Automobile travel is probably a very distant third.44

There has also been a continuous attempt to improve the lot of pedestrians elsewhere on the Historic Peninsula. For example, along Ordu Caddesi as it runs through neighborhoods like Laleli, the traffic lanes on either side of the T1 corridor have recently been replaced by sidewalks. These sidewalks are now extraordinarily wide, and car traffic is no longer allowed on a once major artery. This is a pretty major reworking of urban space. (Scooter drivers and even motorcyclists, however, seem to use the sidewalk with impunity.)

Beyazıt-Kapalıçarşı (Grand Bazaar) station vicinity, Istanbul, Turkey

Crowds near the Beyazıt-Kapalıçarşı (Grand Bazaar) station on the T1 line, where a very wide sidewalk has replaced traffic lanes. A tram can be seen in the background.

Elsewhere in Istanbul, accommodation of pedestrians plays a role in planning even in places where automobiles would be harder to eliminate. In, for example, the Mecidiyeköy area in Şişli, and even northeast of there, where shopping malls and secure high-rise apartment buildings that have plenty of parking dominate the landscape, there are wide, often crowded sidewalks, open-air cafés and restaurants, and subway stations with special underground entrances to important buildings.

Sidewalk, Mecidiyeköy area (Şişli), Istanbul, Turkey

Sidewalk in the Mecidiyeköy area (Şişli) during the Kurban Bayramı holiday period, when some shops are closed and there are surely fewer pedestrians than there usually are.

In recent years, Istanbul has also created a number of recreational corridors. The longest of these are along the Sea of Marmara, where there are almost continuous walking and bicycling paths for several kilometers on both the Asian and European sides of the city.  The corridor on the Asian side is by far the more crowded of these.

Pedestrian and bicycle paths, Bostancı, Istanbul, Turkey

Pedestrians and cyclists on the parallel paths along the Sea of Marmara just east of Bostancı on Istanbul’s Asian side.

The comparable paths and linear parks on the European side were strikingly empty every time I visited—I typically had to wait a long time even to get a single user in a photo. I’m not absolutely sure of the reasons for this. One factor may be that most of the adjacent neighborhoods are a little less dense than on the Asian side. Also, the European side’s seafront parks are bordered by a noisy and polluting freeway, Kennedy Caddesi. A larger issue is that there seem to be few cyclists and runners in Istanbul (a city-wide bike-share system has had difficulty staying in business). It’s possible that Turkish culture may for some reason discourage such individual exercise activities. This has not stopped the urban-area governments from making a major effort to accommodate potential users, however.45

Recreational paths along Sea of Marmara, European side, Istanbul, Turkey

The rather empty bicycle and pedestrian paths in the linear park along the Sea of Marmara on Istanbul’s European side. Kennedy Caddesi is on the right.

Some other new recreational corridors also seemed a little empty to me. The path along the newly rebuilt Sirkeci-Kazlıçeşme rail line that just opened at the beginning of this year is an example. This rail corridor here was once used by both long-distance trains from the rest of Europe and suburban local trains on their way to Sirkeci station. With the opening of the Marmaray, the route lost much of its traffic. It was recently rebuilt as a largely one-track local rail line, and the space taken up by unneeded extra tracks was turned into a modern recreational path.

The Sirkeci-Kazlıçeşme rail line and the parallel recreational path just west of the Cerrahpaşa station. Note Kennedy Caddesi, essentially a freeway, on the left.

The path seemed to me an interesting and pleasurable place to walk along. It passes working-class neighborhoods that still contain Ottoman-era wooden houses, and you get a close-up view of the reworked train line. Unlike the case with many of Istanbul’s sidewalks, the surface is in great shape. But hardly anyone was using the path when I visited, something that made me worry a little about security. (The path has few entrances and exits.)

One of the other long-distance paths I visited seemed similarly underused. The Kağıthane Yeşil Vadi Bisiklet ve Yürüyüş Yolu (2022-2023) is a bicycle and pedestrian path along Kağıthane Creek, which flows into the Golden Horn. The once-industrial valley through which it runs is being turned into a corridor of apartment buildings and offices, and the path has a shiny new surface but only a few users.

Kağıthane Yeşil Vadi Bisiklet ve Yürüyüş Yolu, Kağıthane, Istanbul, Turkey

The brand-new bicycle and pedestrian path along Kağıthane Creek.

There is, however, no shortage of users along the recently renovated but older path that follows the shore of the Bosporus in Üsküdar. This path provides spectacular views of central Istanbul and shipping on the Bosporus. The late afternoon crowds make up what must be one of the largest passeggiate in the whole Mediterranean basin.46 It appears that the inhabitants of Istanbul prefer their pedestrian corridors to have lots of, well, pedestrians.

Pedestrians, Üsküdar, Istanbul, Turkey

Late afternoon strolling in Üsküdar.

So far there is not much indication that the massive effort to add rail lines and pedestrian facilities in Istanbul has had much of an effect on the area’s traffic problems.47 In 2021, Istanbul was classified in the TomTom traffic index as having the world’s worst traffic congestion.48 It hasn’t been easy anywhere in the world to persuade a large proportion of automobile drivers to switch to other transport modes, and Istanbul has had the same difficulties here as every other big urban area.

On the whole, however, I was pretty impressed at the extent to which Istanbul, a city in a middle-income country in a part of the world where one doesn’t expect to find much resistance at all to automobilization, has put so much energy into creating new rail transit lines and better spaces for pedestrians. There isn’t much doubt that the rail lines have improved life for those inclined or compelled to use public transportation and that the new facilities for pedestrians have made it easier and more enjoyable for people to move on foot around many parts of the city.
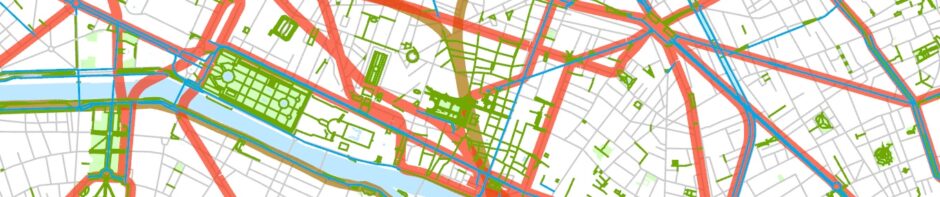
Posted in Urban, Transportation, Rail infrastructure, Pedestrian infrastructure | Tagged | Leave a comment

Neighborhood types in Chicago, 2020

The maps below present a classification of Chicago’s 2020 residential census tracts based on multivariate analysis. This approach (sometimes called social area analysis or factorial ecology in geography and sociology) is often used to classify small areas in cities. The ten neighborhood types identified on the maps were derived through a two-step process. First, the TRYSYS program was used to factor 34 important tract-level census variables by the Tryon “key-cluster analysis” method. The data come either from the 2020 census or from the 2018-2022 American Community Survey. Three oblique dimensions were identified. Then each tract was scored on the three dimensions (using a simple sum of standardized scores), and tracts were cluster-analyzed using TRYSYS’s iterative partitioning method. Robert B. Dean did the statistical analysis.

These maps are comparable to those generated for 1990 and 2000 data when I was working at the University of Chicago Library and for 2010 data as reported on this blog. (I’m guilty of repeating some of the language from the 2010 post.) Essentially the same variables were used, and nearly the same geographic area was covered. The three dimensions (or clusters) are very similar to the first three dimensions found in the 1990 and 2000 data (although the order of the first two is different) and the three dimensions identified in 2010. The three dimensions involve [1] measures of wealth and high status; [2] measures of traditional urbanity; and [3] measures of linguistic isolation. These three dimensions account for approximately 95 percent of the communality in the 34 variables. I acknowledge that it could be argued that the use of a set of standard census statistical data pretty much foreordains the identification of three dimensions more or less like these, since most census data fits fairly clearly into one of these categories.

In fact, there are other ways to analyze the statistical data. In both 1990 and 2000, a fourth dimension was identified, associated with family type and age. A similar dimension in the 2010 data was not at all significant, and it’s pretty much completely disappeared in 2020. But in 2020 the initial analysis did once again identify a fourth dimension. It brought together five definers: percent of population African-American, percent of population with a female “householder,” percent of working-age population unemployed, percent of families below the poverty line, and (negatively) percent of population white. This cluster had as great a significance level as cluster 3, which groups together measures of linguistic and cultural isolation. But it had the awkward problem of having a high (although negative) correlation with cluster 1, which groups together measures of wealth and status. The program used here—TRYSYS—does allow the analyst to make some choices at certain points. Subsuming cluster 4 into cluster 1 seemed both statistically plausible and, in fact, sensible, since it has similar explanatory power as identifying four dimensions and simplifies the result. Parsimonious results are prized in statistical and social analysis. But I’d be the first to admit there is something a bit odd about combining measures of wealth with measures of ethnicity and social structure in one dimension. The counterargument would be that this is the analysis to which the statistics point. Per capita income, for example, is significantly correlated (.576) with percent white. Median household income, for example, really does have a high negative correlation (-.646) with percent of households with a female householder. It’s true that the measures of wealth and status have a higher correlation with each other than with the ethnic and socioeconomic variables mentioned above, and the latter have a higher correlation with each other than to the measures of wealth and status.

In the end, whether one keeps dimension 4 or not, cluster analysis of Chicago’s 2020 census data reveals the continued distinctiveness of Chicago’s most disadvantaged African-American neighborhoods. They are not only poorer than other parts of the Chicago region; they have certain social characteristics that separate them from, say, neighborhoods with a large number of recent immigrants that are nearly as poor. Neighborhoods whose population includes a large proportion of ethnic Latin Americans, for example, do not have as large a percentage of female householders or unemployment rates that are quite as high as the poorer African-American neighborhoods..

In general, the broad pattern of Chicago’s social geography appears to have changed only in subtle ways in the first decades of the 21st century. This is not surprising when you consider that Chicago’s population and economy have been pretty stable. A few obvious changes are noted on the page with a description of variables. There definitely has also been a considerable amount of ethnic-specific internal migration in the area. Click here for some maps that demonstrate this.

Note that, because the classifications have changed, the color schemes of the 1990, 2000, 2010, and 2020 neighborhood-type maps, while similar, are not completely comparable.

Note also that, while the program forces every tract to be classified into one neighborhood type or another, most of the neighborhoods identified by the classification algorithm are definitely not homogeneous. Minor changes in the census numbers for many tracts would have moved many of them from one category to another.

No claim can be made that this is a definitive analysis of neighborhood types in Chicago. It is in the nature of this kind of analysis that a change in the variables selected or in the parameters set by the analyst can change the results significantly. The best that can be said is that the maps may provide one useful way of analyzing the differences in Chicago’s residential areas.

I’m inclined to argue that the fact that the analysis does seem to result in maps that show coherent patterns of socioeconomic geography does suggest that there’s at least some validity to the statistical exploration presented here.

One final bit of explanation: The thin black lines on the map are tract boundaries. The heavy black line shows Chicago’s city limits. The heavy dark-grey lines show the area’s freeway network.

Here’s a map showing neighborhood types in Chicago and some of its inner suburbs. Nominal scale is 1:100,000. That’s the scale it would have if printed on a 17-x-22-inch sheet of paper. (Click here for key.)

Map, neighborhood types, 2010, Chicago, Illinois, and vicinity

And here’s a map showing neighborhood types in the Chicago region. Nominal scale is 1:250,000. That’s the scale it would have if printed on a 17-x-22-inch sheet of paper. (Click here for key.)

Map, neighborhood types, 2020, Chicago region


Posted in Urban | Tagged | Leave a comment

Three dimensions, 2020

The analysis of neighborhood types in Chicago in 2020 suggests that three oblique key-cluster dimensions underlie the 34 variables used in the computations. The dimensions are listed below with their correlations to the most salient dimension definers (note that the names of the dimensions are a little arbitrary; some of these dimensions are quite complex in character):

Wealthy/High Professional Status vs. Impoverished/Low Professional Status [Welloff vs. Poor].

The eleven definers (with their oblique factor coefficients) are:

[+.886] Mean per capita income
[+.880] Percent of population 25+ with college degree
[+.873] Median household income
[+.838] Percent of workers 16+ with managerial/professional occupation
[-.836] Percent of households with female householder
[+.785] Median value of owner-occupied housing units
[+.742] Percent non-Hispanic white (alone)
[-.677] Percent of families below poverty line
[-.642] Percent of population non-Hispanic African-American (alone)
[+.632] Median monthly rent of occupied rented housing units
[+.488] Percent with Russian or Ukrainian ancestry

Urban vs. Suburban.

The eleven definers are:

[-.889] Percent in owner-occupied dwelling
[-.867] Percent in single-family housing unit
[+.829] Percent of housing units with no vehicle
[-.820] Percent of households with married-couple
[+.788] Percent of households that are “non-family”
[+.721] Percent of workers 16+ using public transportation to get to work
[+.685] Persons per square kilometer
[+.654] Percent of housing units in buildings with ten or more housing units
[-.648] Percent of population aged 50-64
[+.603] Percent of population aged 19-29
[+.507] Percent of households with same-sex spouses or partners

Linguistically Isolated/Hispanic vs. English-Speaking/Native-Born [NonEng vs. Native].

The three definers are:

[+1.026] Percent unable to speak English well
[+.843] Percent foreign-born
[+.767] Percent Hispanic/Latino

The three dimensions are intercorrelated as follows.

1 2 3
1 1 -.179 -.182
2 -.179 1 0.124
3 -.182 .124 1


Posted in Urban | Leave a comment

34 variables, 2020

Here’s a list of the 34 variables used in the analysis of socioeconomic data for Chicago-area 2020 census tracts. The first seven variables plus the age variables (10-14) consist of data from the 2020 Census. The other variables come from the 2018-2022 American Community Survey (ACS). All the data were downloaded from IPUMS-NHGIS.

DENS  Population per square kilometer of land area
WHITE  Percent non-Hispanic white (alone)
AFAM  Percent non-Hispanic African-American (alone)
ASPI  Percent non-Hispanic Asian or Pacific Islander (alone)
HISP  Percent Hispanic/Latino
MARCHH  Percent of households including a married couple
SAMESX   Percent of households with same-sex spouses or partners
PERSHH  Persons per household
OWNOCC  Percent of occupied housing units owner-occupied
PCLT18  Percent of population aged 0-17
PC1829  Percent of population aged 18-29
PC30-49  Percent of population 30-49
PC5064  Percent of population aged 50-64
PC65UP  Percent of population aged 65+
FEMHH  Percent of households with female householder
PCAPINC  Mean per capita income
COLLDG  Percent of population 25+ with college degree
PUBTRN  Percent of workers 16+ using public transportation to get to work
MANPRF  Percent of workers 16+ with managerial or professional jobs
NOCAR  Percent of housing units with no vehicle available
HOUINC  Median household income
ITAL  Percent of population with Italian ancestry
POLISH  Percent of population with Polish ancestry
RUSS  Percent of population with Russian or Ukrainian ancestry
RENT  Median monthly rent
NONFAM  Percent of households non-families
HOUVAL  Median value of owner-occupied housing units
FORBRN  Percent of population foreign-born
UNEMP  Percent of workers 16+ unemployed
LINGIS  Percent of population 5+ unable to speak English well
POOR  Percent of families below poverty line
SINFAM  Percent of occupied housing units that are single-family homes
TENPLU  Percent of occupied housing units in buildings with ten or more housing units
YEAR  Median year housing built

These variables are very nearly the same as those used in the 2010 analysis reported on this blog, but there are some small differences, caused either by changes in the questions asked by the Census Bureau or by, well, events (or both):

[1] SAMESX. The data now include both married and partnered same-sex couples. The numbers (not surprisingly), while still generally low, are higher (and perhaps more reliable) than in 2010.

[2] FEMHH. The Census Bureau has (quite reasonably) done away with the concept “head of household” and substituted the less suspect term “householder,” which refers to the name of the person in whose name a housing unit is owned or rented. There is no longer the implication that he or she is head of anything. I don’t know how this change has affected the numbers.

[3] RUSS. This variable in 2020 includes both those who said they had Russian ancestry and those who said they had Ukrainian ancestry. I assume (but can’t prove) that many people whose ancestry was in the Russian Empire might now be more inclined to claim Ukrainian ancestry. The variable is a very imperfect surrogate for Jewish ancestry (the Census Bureau does not ask questions about religion).

[4] LINGIS. This variable is now used to report the proportion of those 5 and above who could not speak English very well. I don’t know how the change from “linguistically isolated” has affected the numbers.

[5] POOR. Formerly this slot was used for percent of families on public assistance. I couldn’t locate the identical question in the 2018-2022 ACS and substituted percent of families below the poverty line. This is the most important change in the variable list. I suspect but can’t prove that percent of families on public assistance (not defined with great precision) is closely correlated with percent of families below the poverty line.


Posted in Urban | Leave a comment

Neighborhood types, 2020

In the statistical study of neighborhoods in Chicago, 2020, cluster analysis of the three dimensions underlying the 34 variables yielded ten neighborhood types. For each neighborhood type, the following list includes:

[a] the neighborhood-type number;
[b] the T-scores on the three dimensions; and
[c] a short name derived mechanically from the scores on the three dimensions. A simple descriptive phrase (like “Welloff” or “NonEng”) indicates a standard deviation from the mean of .5 to 1; the same phrase preceded by V (e.g., “VWelloff” for very well-off) indicates a standard deviation from the mean of between 1 and 1.5; repeated “V”‘s are used for additional half-standard deviations from the mean.

The ten neighborhood types are:

  1. 1.(65.83 70.31 45.65). VVWelloff VVVUrban. Well-off, extremely urban neighborhoods. Prosperous inner-city areas with mostly “professional” populations. The North Side Lakefront and the neigborhoods around the Loop, with small outliers in Hyde Park, Evanston, and Oak Park. Relatively few non-English speakers. Extends a little further west and north in a few places than the comparable neighborhood type in 2010.
  2. (51.97 68.46 51.78). VVUrban. Somewhat less well-off very urban areas, mostly found on the edges of the more thoroughly gentrified tracts of type 1. Generally, more non-English speakers than in type 1.
  3. (66.33 39.07 44.67). VVWelloff VSuburban Native. Well-off suburban neighborhoods with few non-English speakers. Old-line wealthy suburbs, largely in northern Cook County and in parts of DuPage County.
  4. (62.11 48.46 47.73)VWelloff. Prosperous neighborhoods, mostly in suburban areas, with few non-English speakers. Mostly on the edges of tracts of type 3. Also includes some small areas having mostly single-family homes (or a substantial amount of density-lowering parkland) in central Chicago.
  5. (49.71 46.48 48.98). Neutral. None of the dimension scores is even half a standard deviation from the mean. Mostly inner-suburban (or outer-city) areas, especially in on the Northwest and Southwest Sides.
  6. (53.85 40.79 43.56). Suburban Native. Suburban neighborhoods with few non-English speakers. Very common. Forms a rough ring around the more distinctive inner suburbs.
  7. (33.98 62.69 41.79). VVPoor VUrban Native. The core, generally impoverished African-American neighborhoods of the South and West Sides and Gary, Indiana.
  8. (37.62 51.19 44.42).VPoor Native. Generally, African-American neighborhoods in the outer parts of Chicago as well as in Gary, Maywood, and a few older central places like Joliet and Waukegan.
  9. (41.37 53.83 74.91). Poor VVVNonEng. More than two standard deviations above the mean on dimension 3. The core Hispanic areas: Little Village and parts of Humboldt Park. Also includes enclaves in old central places like Waukegan, Elgin, Aurora. and Joliet as well as numerous small areas throughout the suburbs (some of which were not as apparent in the 2020 analysis).
  10. (46.49 50.23 63.09). NonEng. Mostly urban or inner-suburban areas that have many (but not an overwhelming number of) non-English speakers. Includes many tracts on the Northwest Side of Chicago and in widely scattered suburbs where there are substantial numbers of relatively recent immigrants from Asia, Eastern Europe, and Latin America. Also includes Chinatown. There are many more suburban tracts in this category in 2020 than there were in the roughly similar category in 2010. This presumably reflects continued immigration.


Posted in Urban | Leave a comment